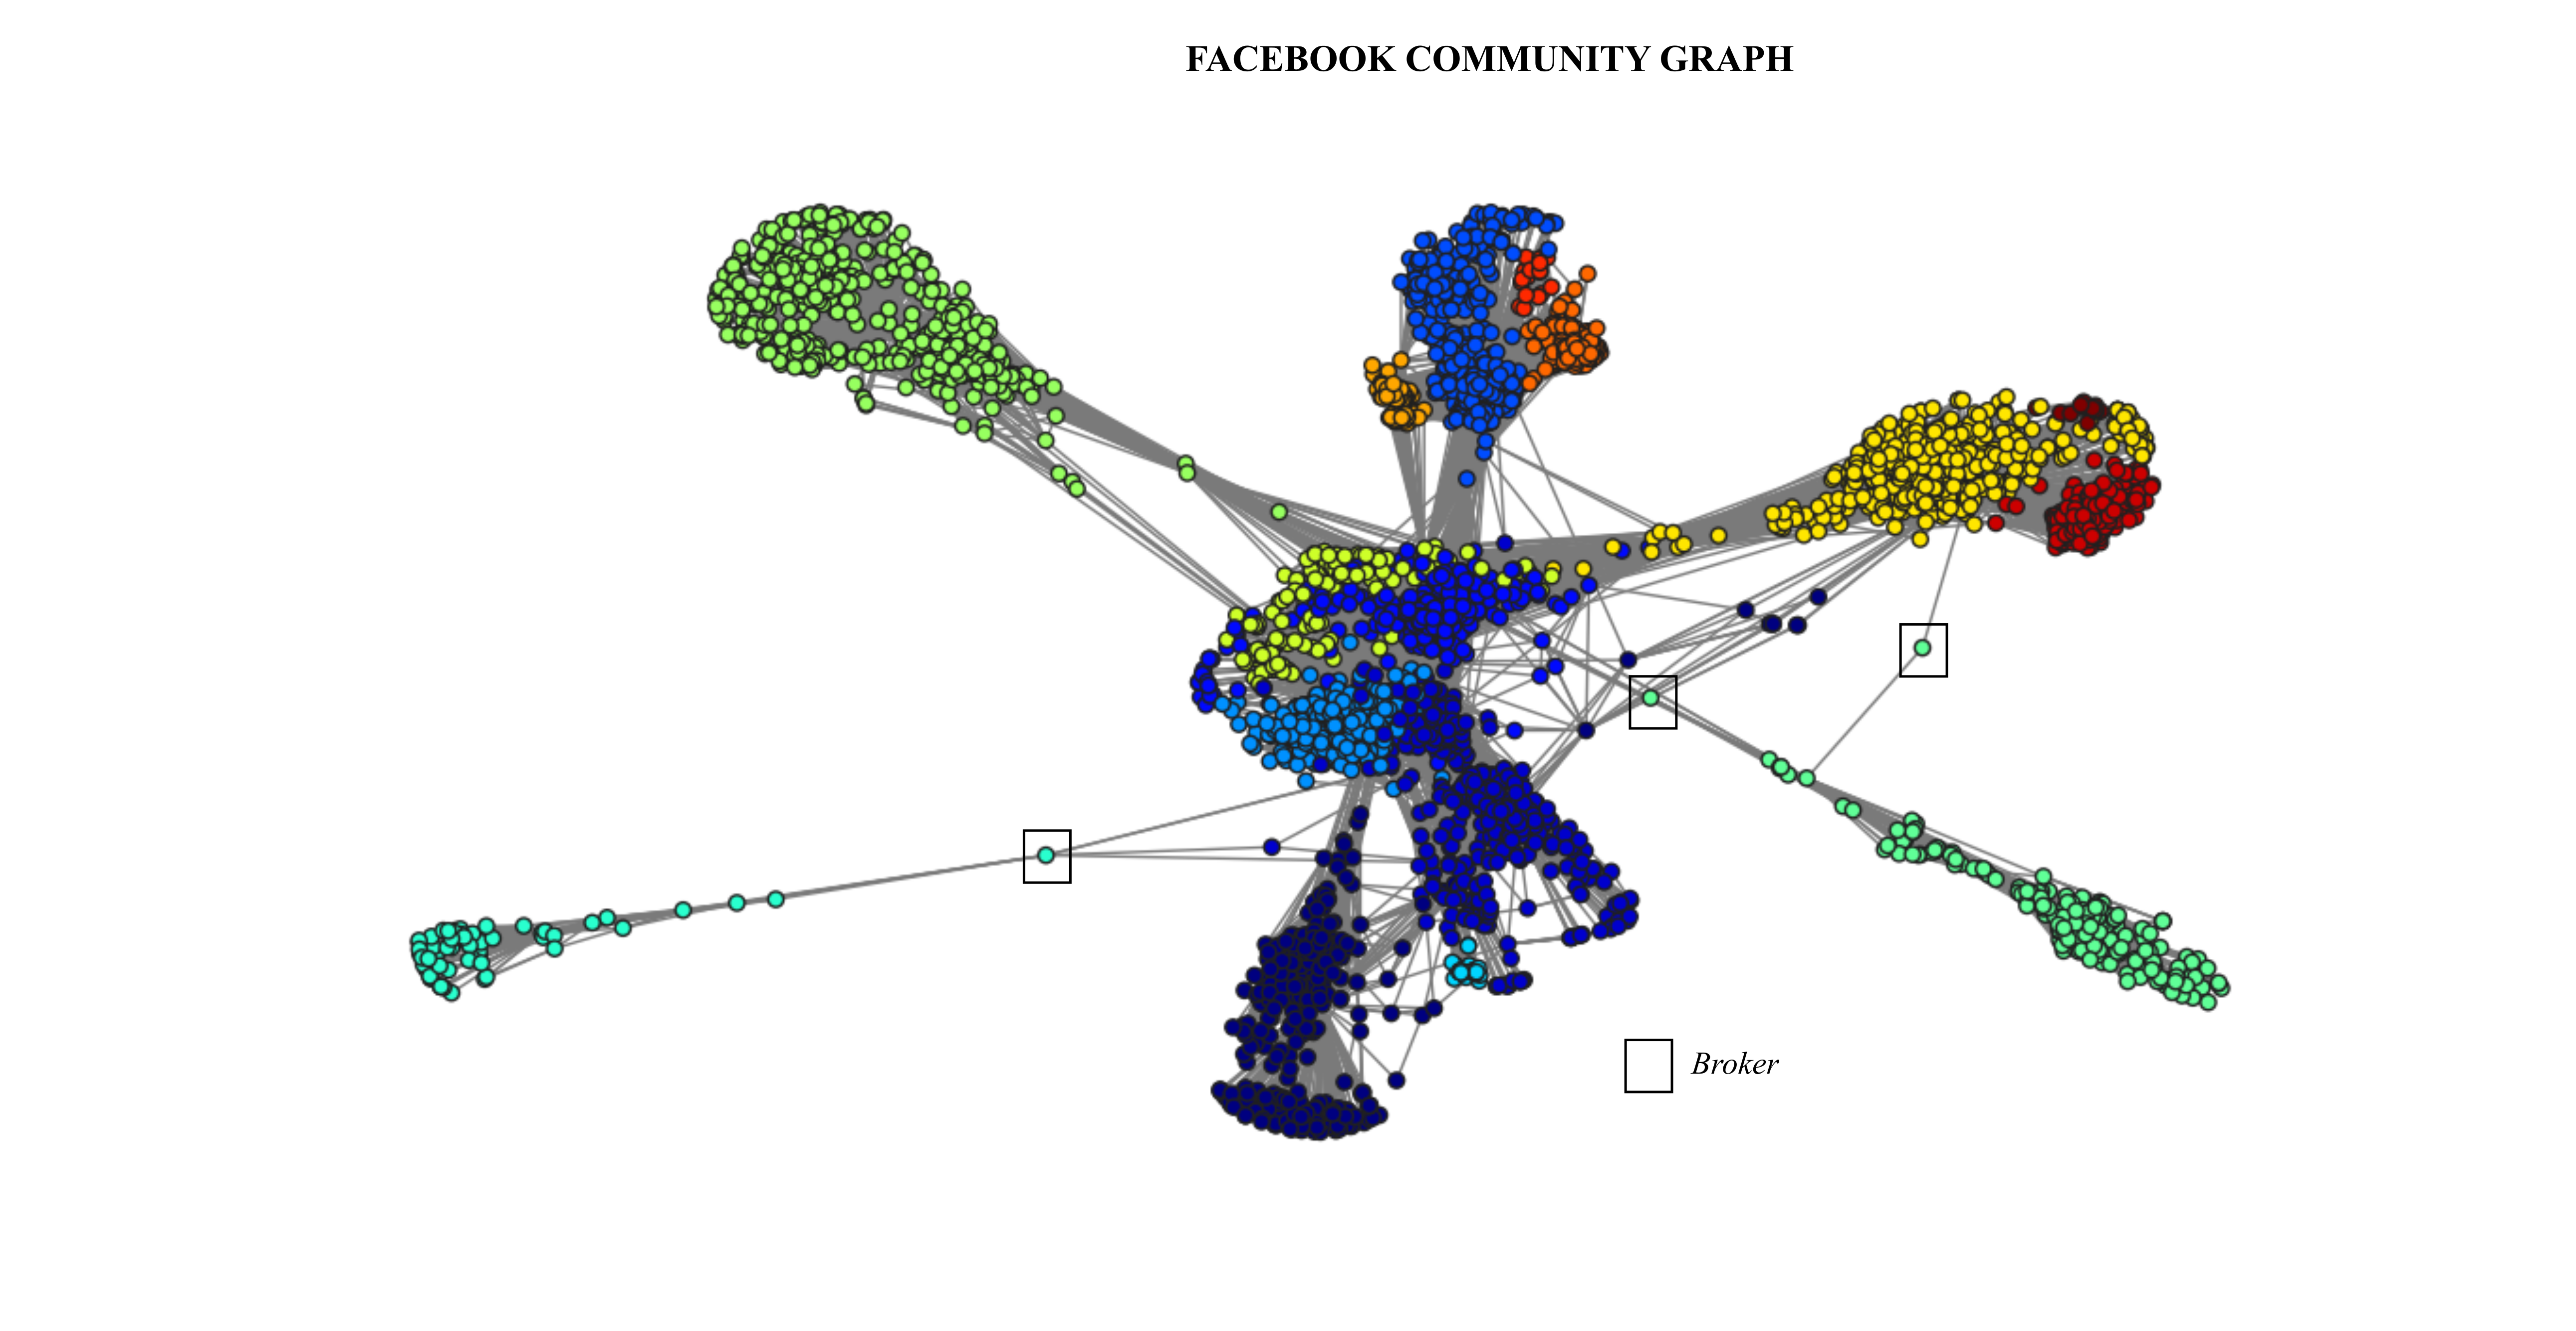
Community Graph
This is Community Network Graph of facebook dataset generated using a coommunity detection algorithm developed by Thomas Aynaud. The dataset contains 4039 nodes and 88234 edges. Undirected graph used to represent friendship between person. Node degree may represent person charm. By measure nodes density, we want to reveal any social group or community.
As we can see, there were at least seven communities formed from facebook dataset. All communities defined by their density. Furthermore, some communities tend to make isolation from major cluster. Some isolated communities may only communicate to major cluster through only one person. We call this kind of person as broker.
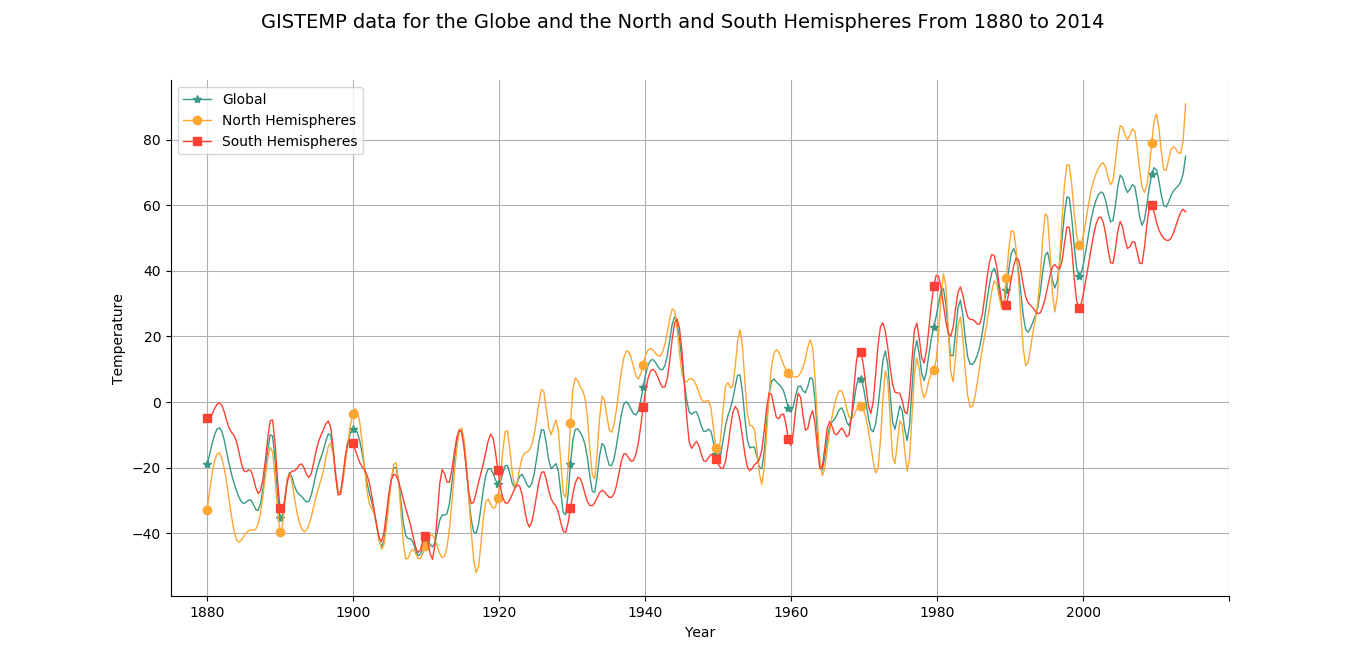
GISS Surface Temperature Analysis (GISTEMP) Visualization
Ever wonder why many countries above equator such as China and India have been suffered hot temperature?
This graph my answer your question.
Built using Matplotlib. Data taken from: NASA
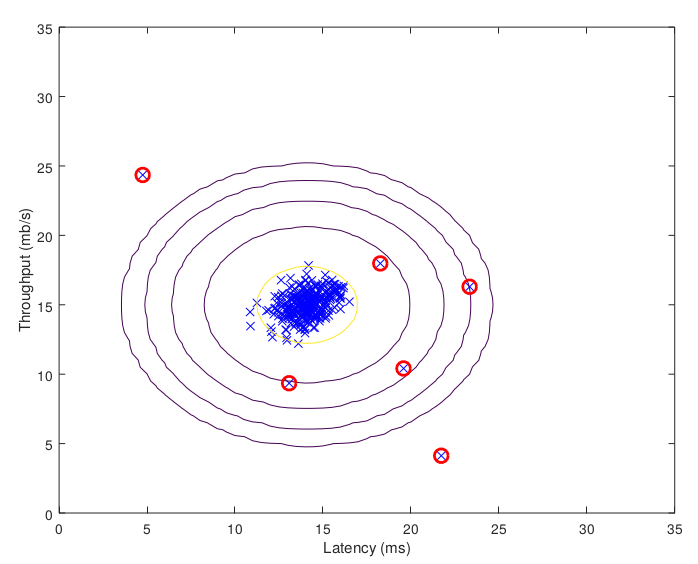
Anomaly Detection
Using Gaussian Distribution Estimation to detect anomalous behavior in server computers. All normal server behaviors placed in the middle of contours, while all abnormal server behaviors placed far from the middle of contours.
A dataset contains thousand of server behavior and consists eleven features. But in this case, I only used two features: throughput (mb/s) and latency (ms). Intuitively, we expect that data contains so many normal server behaviors, but small abnormal server behaviors. So, based on that estimation, I used gaussian distribution model all servers behaviors. An image above visualize Gaussian distribution contours.
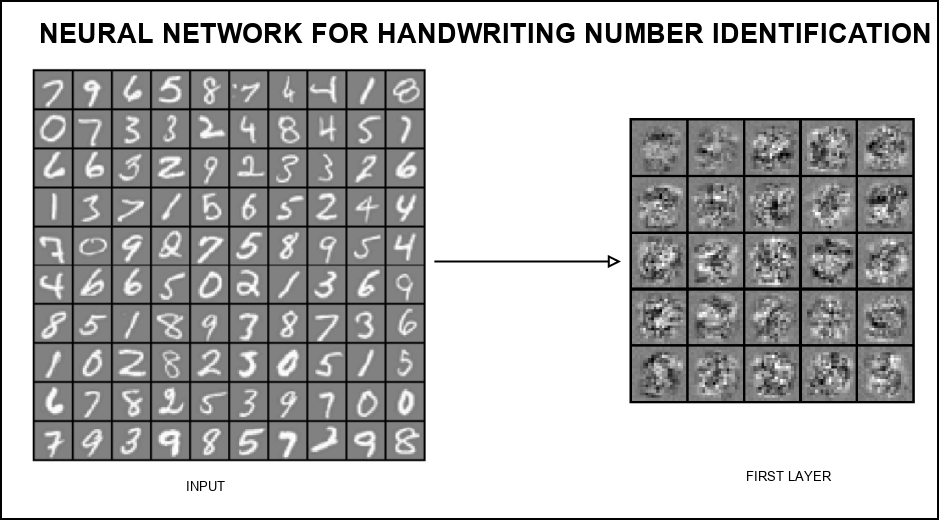
Neural Network for Number Handwriting Identification
Use Octave and linear algebra to construct neural network architecture for number handwriting identification.
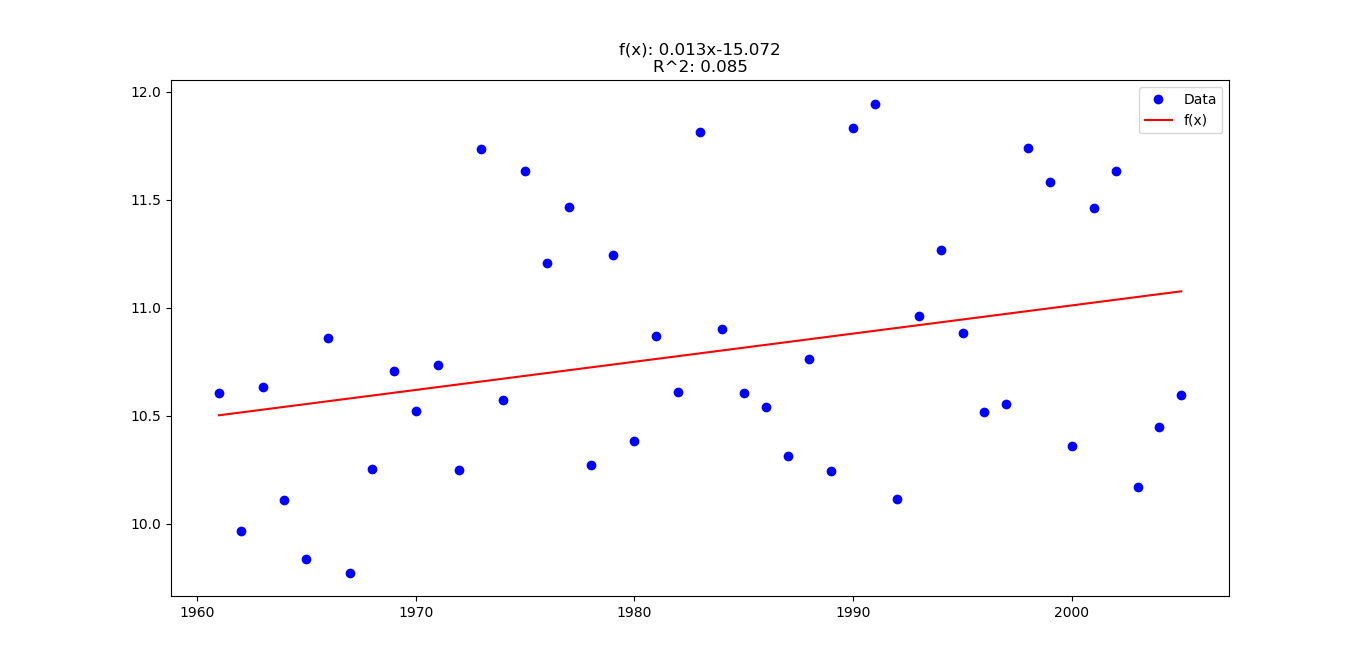
Global warming Visualization
Global warming forecast using Linear Regression. Use Matplotlib for visualization.
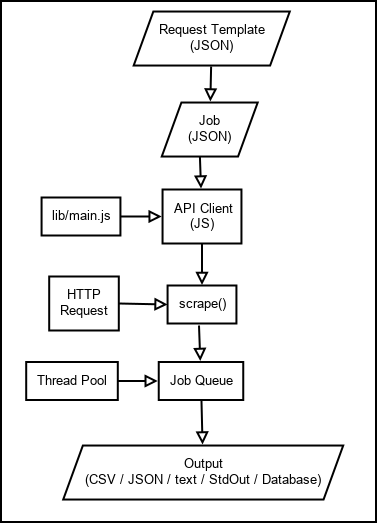
Web Aggregation Framework
Web aggregation framework that make API mining easier. Built on Node.js.
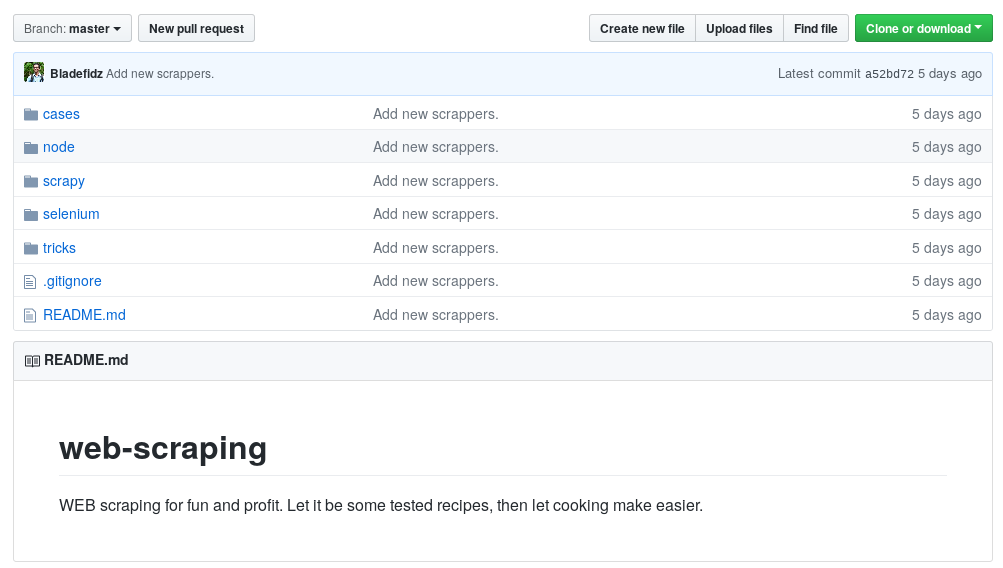
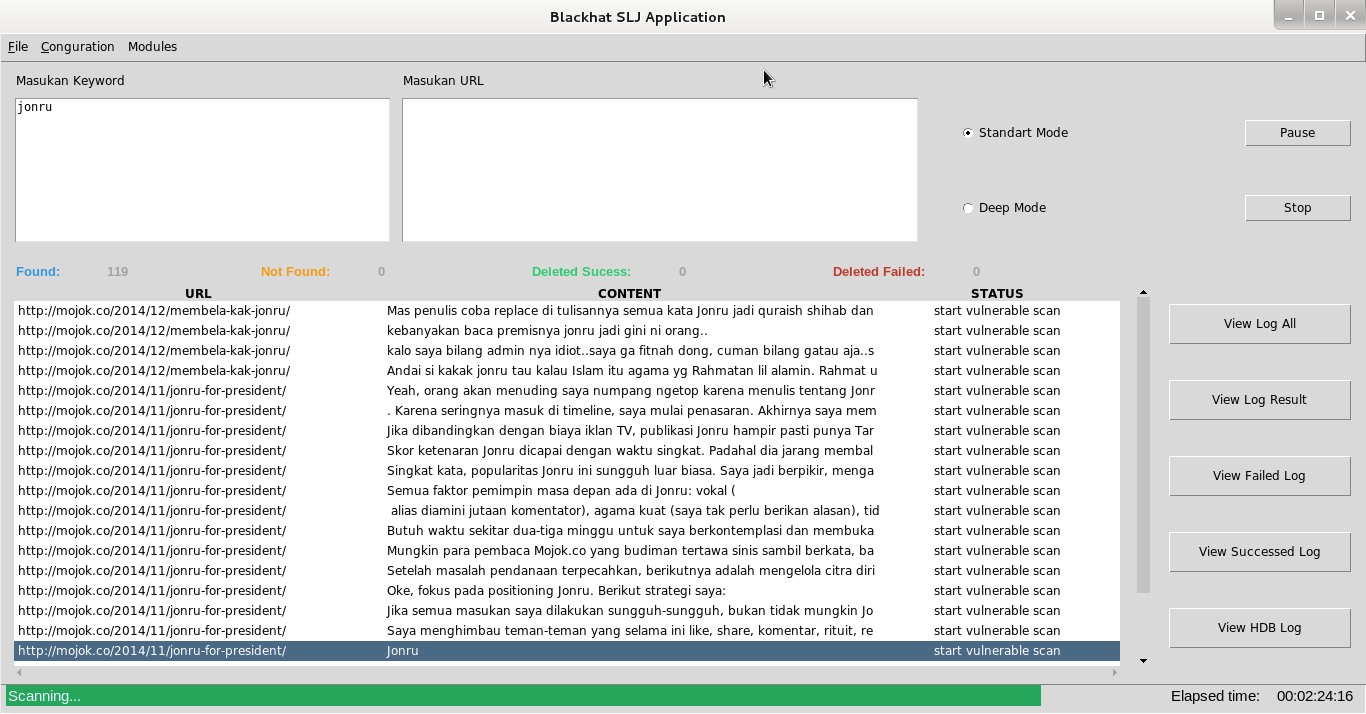
Web Scrapping Jobs
List of Web Scrapping Jobs that I have done. 90% of jobs done by using Scrapy Framework, while at rest done by using Node.JS and Selenium.
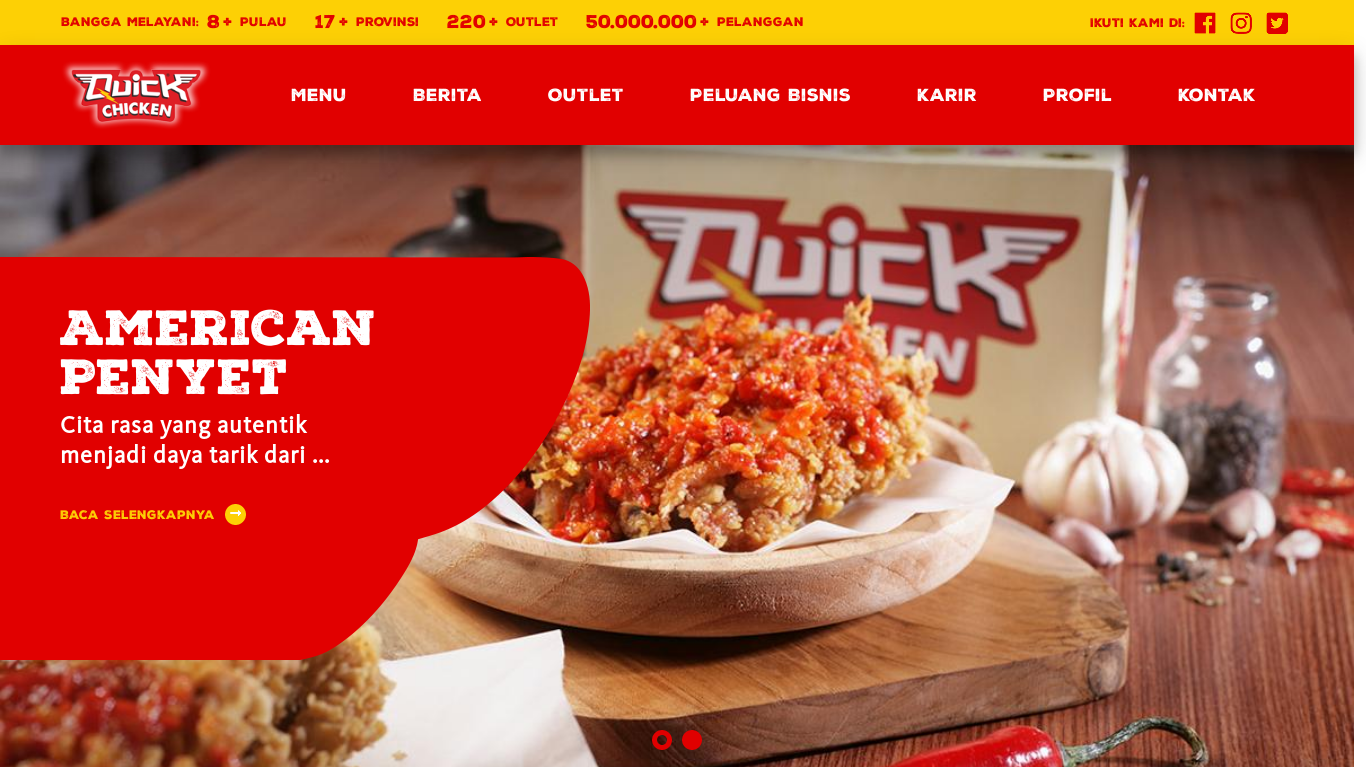
Quick Chicken
Built CMS (Content Management System) for Quick Chicken web site. Used Alpha CMS (corporate own cms) on top Laravel Framework.
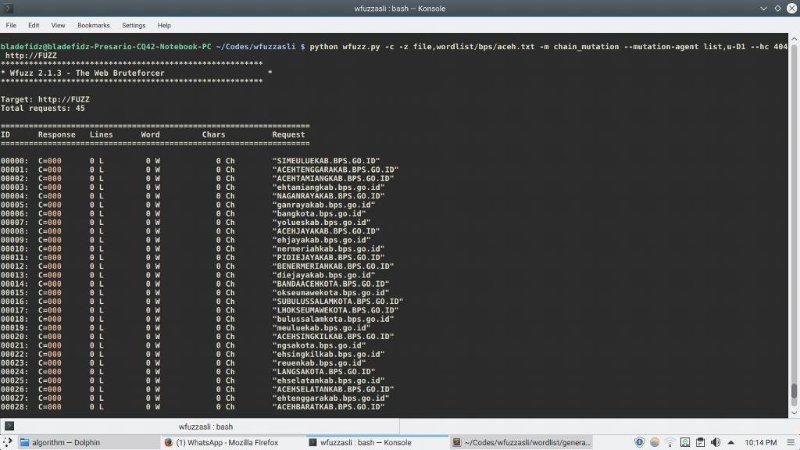
Penetration Testing on BPS (Badan Pusat Statistik)
[Copyright owned by client] Built custom penetration modules on wfuzz framework.

Smart Teacher
[Declined] Smart Teacher App will increase teaching passion and student contribution.
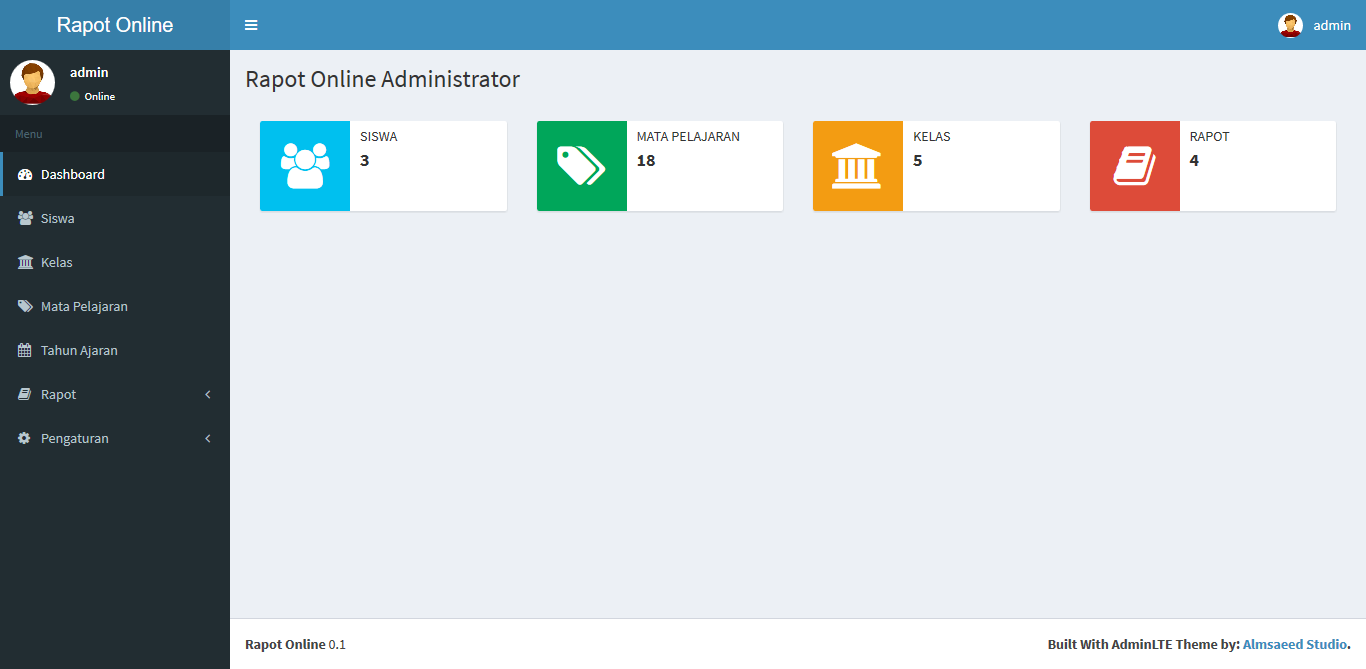
Rapot Online
Simple student report system built with YII Framework.
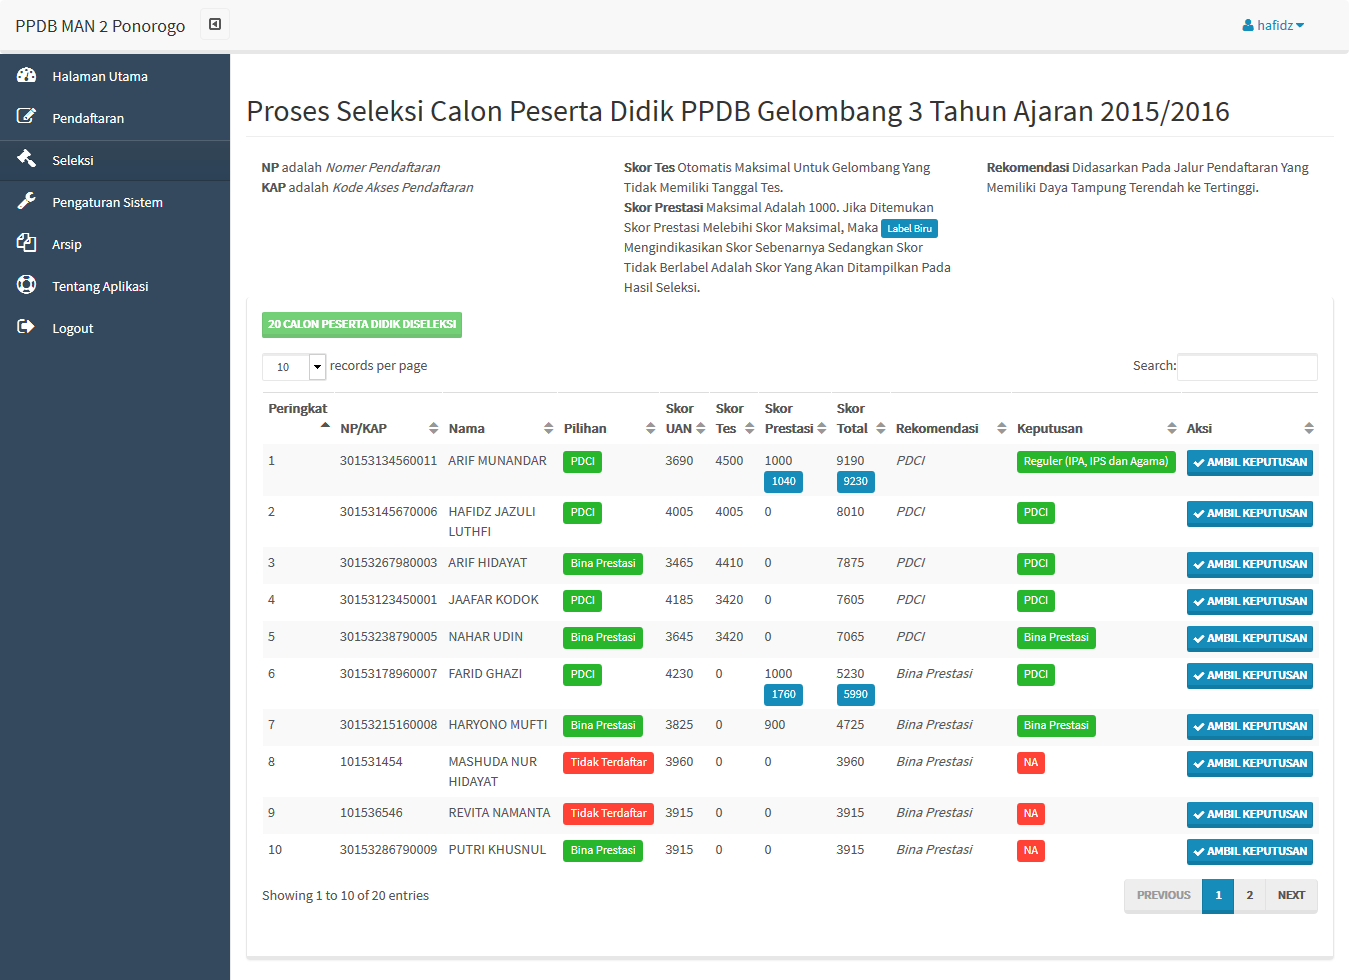
PPDB Online
Simple Online Student Registration System. Bult With Simplex Framework (My Own Framework).
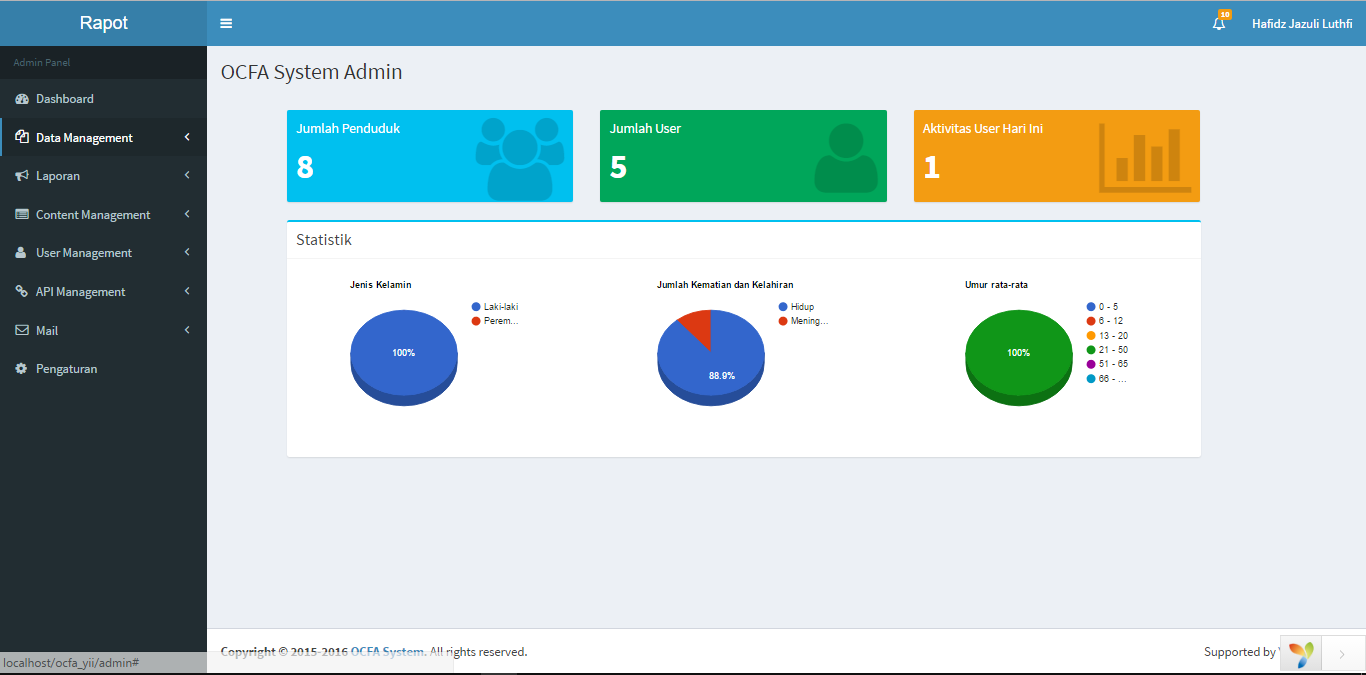
OCFA System
This system would make civil data management become easier. This system cover all civil data, icluding KTP, kartu Keluarga, kematian, kelahiran, etc. This system provide API that can be used for mobile app. Built with help from two very creative developer, Kamal El-Fadl and Jafar Hisyamudin.
SIMPLEX Framework
Fast and high performance micro PHP Framework
News web mining
[Copyright owned by client] A news web mining built using Python and Scrapy Framework.
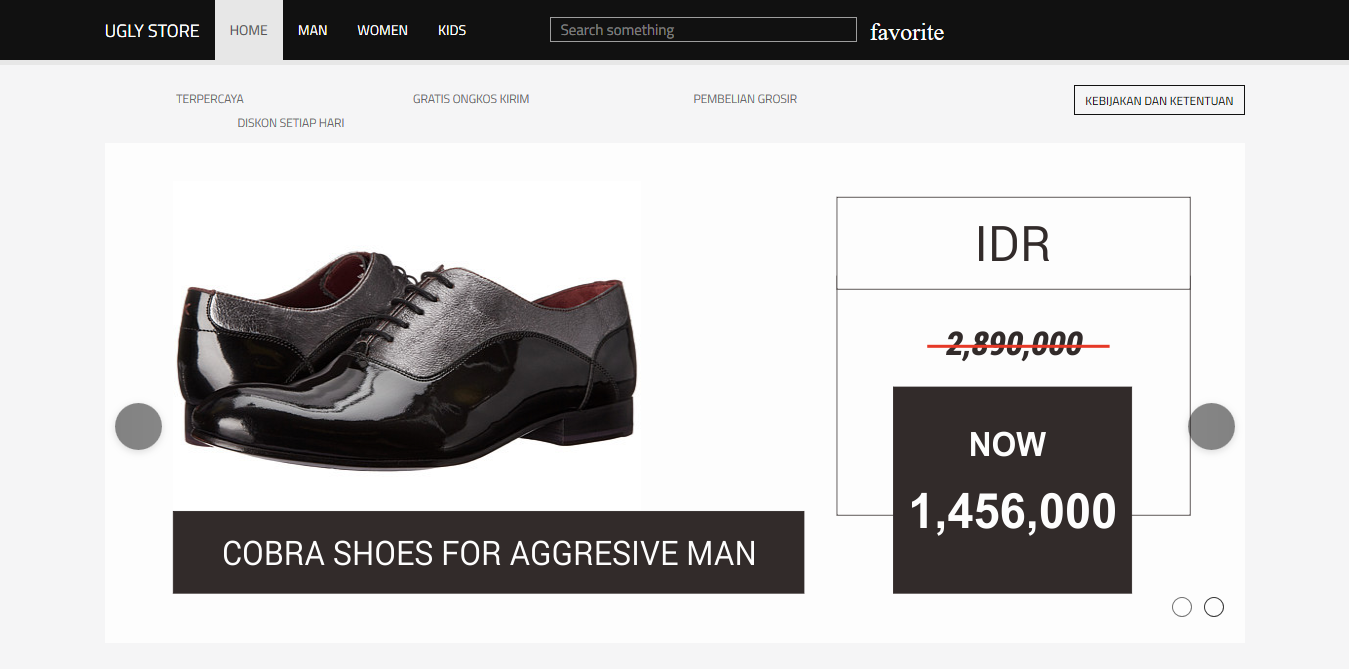
Boxify Store
Online Shoes Shop Template.
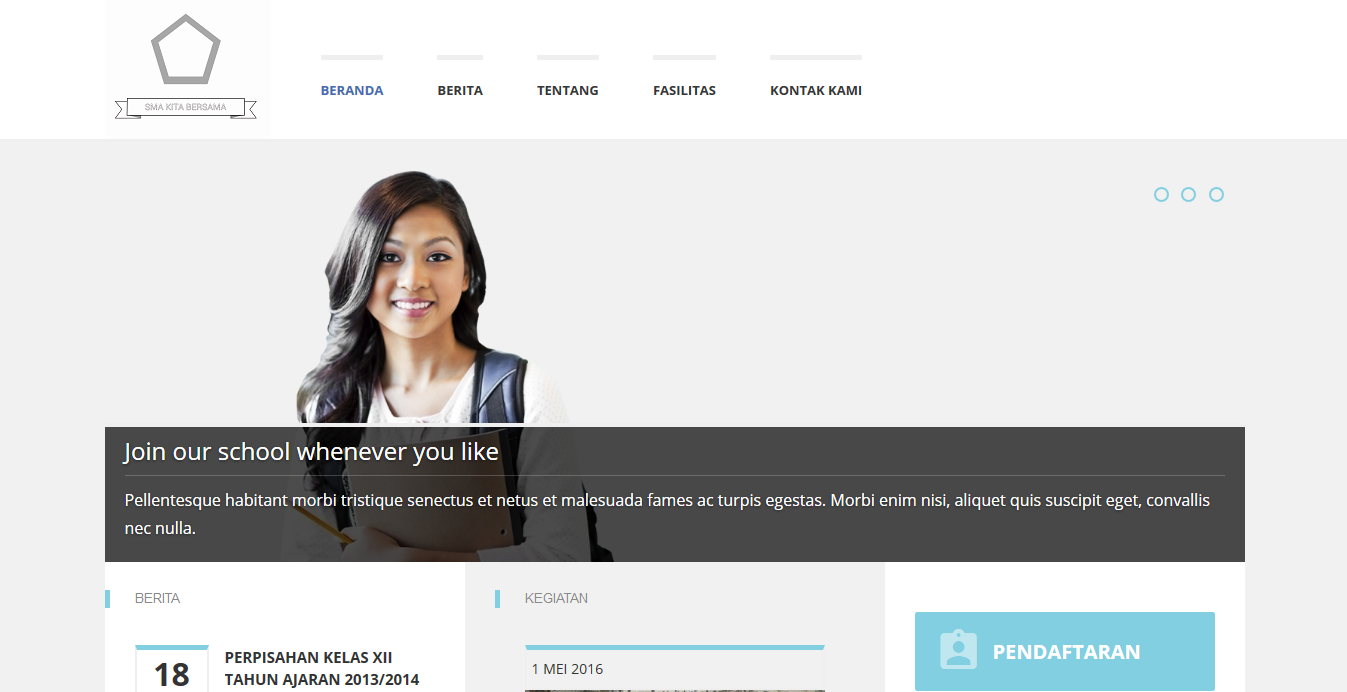
WebSchool
School website template.